
こんにちは!データサイエンティストの青木和也(https://twitter.com/kaizen_oni)です!
この記事では、時系列データにクラスタリングを適用する目的でHMMを使用した時に、AttributeErrorが出てしまった時の対処法をお教えいたします!
データ可視化学入門のコードを実行している最中に出てきてしまったエラーなので、少しびっくりしたのですが、落ち着いて対処すれば解決可能です!
本記事を参考に、コードを微調整していただいて、演習を続行いただければと思います!
エラーの内容
当該コードはデータ可視化学入門のP116の図4.3.7「HMMによる時系列解析」のコードを実行時に発生してしまいました。
なお、以下のコードは著者の江崎貴裕先生のGithubに公開されているコードを参考にしております。
import hmmlearn as hmm
from matplotlib.colors import ListedColormap, Normalize
from matplotlib.gridspec import GridSpec
from matplotlib.colorbar import Colorbar

def generate_positive_semi_definite(n):
    M = np.random.rand(n,n)
    return np.dot(M, M.transpose())

n_samples = 101
n_features = 5
n_components = 3

model = hmm.GaussianHMM(n_components = n_components, covariance_type = 'full')

np.random.seed(2)
model.startprob_ = np.random.random(n_components)
model.startprob_ /= model.startprob_.sum()
model.transmat_ = np.random.random((n_components, n_components))
model.transmat_ /= model.transmat_.sum(axis = 1, keepdims = True)
model.means_ = np.random.random((n_components, n_features))
model.covars_ = np.stack(
    [generate_positive_semi_definite(n_features) for _ in range(n_components)]
)

X, Z = model.sample(n_samples)

Z_pred = model.predict(X)
Z_pred_100 = np.repeat(Z_pred, 100)

fig = plt.figure(figsize = (10,10))
gs = GridSpec(8,4,height_ratios = [1] * 5 + [0.8] + [2.5, .5], hspace = 0.5)

cmap = plt.get_cmap('jet')
norm = Normalize(vmin = -3, vmax = 3)
cmap_state = ListedColormap(
    cmap(norm(np.arange(n_components)))
)
cmap_tr = plt.get_cmap('coolwarm')
norm_tr = Normalize(vmin = 0, vmax = 1)
norm_mean = Normalize(vmin = 0, vmax = 1)

for i in range(n_features):
    ax = plt.subplot(gs[i, 0:4])
    ax.set_ylim(-10,10)
    ax.set_xlim(0, n_samples - 1)
    ax.plot(X[:, i])
    for state in range(n_components):
        ax.fill_between(
            np.arange(0, n_samples, 0.01), -10, 10,
            where = (Z_pred_100 == state),
            color = cmap_state(state), alpha = 0.3
        )

    ax.set_ylabel(f'変数 {i+1}')
    if i == n_features -1:
        ax.set_xlabel('時間ステップ')

state_names = ['A', 'B', 'C']
for i in range(n_components):
    ax = plt.subplot(gs[n_features + 1: n_features + 2, i])
    sns.heatmap(
        model.covars_[i], ax = ax, cmap = cmap,
        norm = norm, cbar = True, cbar_kws = {'ticks': [-3,0,3]}
    )

    ax.set_title(f'状態 {state_names[i]}')
    if i == 0:
        ax.set_ylabel('共分散行列')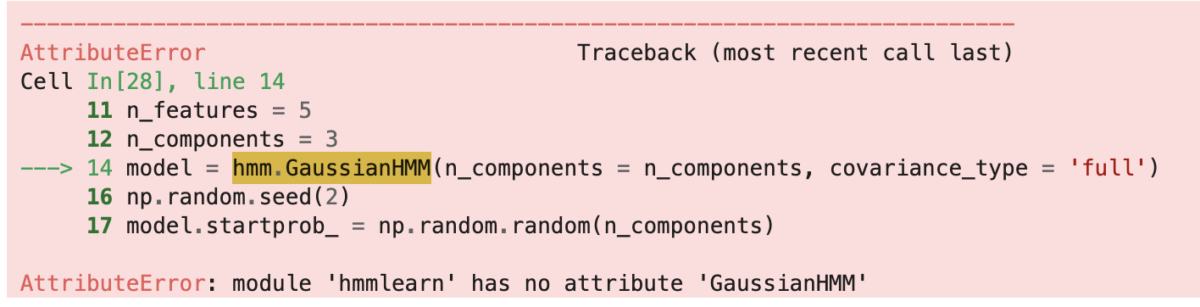
エラーの内容としては、「hmmlearnモジュるにGaussianHMMなんてメソッド(または変数)はないよ」と言われてしまっています。
解決方法
上記エラーの解決方法は至ってシンプルで、GaussianHMMをインポートする際に、hmmlearnからインポートするのではなく、hmmlearn.hmmからインポートすればOKです。
import hmmlearn.hmm as hmm
from matplotlib.colors import ListedColormap, Normalize
from matplotlib.gridspec import GridSpec
from matplotlib.colorbar import Colorbar

def generate_positive_semi_definite(n):
    M = np.random.rand(n,n)
    return np.dot(M, M.transpose())

n_samples = 101
n_features = 5
n_components = 3

model = hmm.GaussianHMM(n_components = n_components, covariance_type = 'full')

np.random.seed(2)
model.startprob_ = np.random.random(n_components)
model.startprob_ /= model.startprob_.sum()
model.transmat_ = np.random.random((n_components, n_components))
model.transmat_ /= model.transmat_.sum(axis = 1, keepdims = True)
model.means_ = np.random.random((n_components, n_features))
model.covars_ = np.stack(
    [generate_positive_semi_definite(n_features) for _ in range(n_components)]
)

X, Z = model.sample(n_samples)

Z_pred = model.predict(X)
Z_pred_100 = np.repeat(Z_pred, 100)

fig = plt.figure(figsize = (10,10))
gs = GridSpec(8,4,height_ratios = [1] * 5 + [0.8] + [2.5, .5], hspace = 0.5)

cmap = plt.get_cmap('jet')
norm = Normalize(vmin = -3, vmax = 3)
cmap_state = ListedColormap(
    cmap(norm(np.arange(n_components)))
)
cmap_tr = plt.get_cmap('coolwarm')
norm_tr = Normalize(vmin = 0, vmax = 1)
norm_mean = Normalize(vmin = 0, vmax = 1)

for i in range(n_features):
    ax = plt.subplot(gs[i, 0:4])
    ax.set_ylim(-10,10)
    ax.set_xlim(0, n_samples - 1)
    ax.plot(X[:, i])
    for state in range(n_components):
        ax.fill_between(
            np.arange(0, n_samples, 0.01), -10, 10,
            where = (Z_pred_100 == state),
            color = cmap_state(state), alpha = 0.3
        )

    ax.set_ylabel(f'変数 {i+1}')
    if i == n_features -1:
        ax.set_xlabel('時間ステップ')

state_names = ['A', 'B', 'C']
for i in range(n_components):
    ax = plt.subplot(gs[n_features + 1: n_features + 2, i])
    sns.heatmap(
        model.covars_[i], ax = ax, cmap = cmap,
        norm = norm, cbar = True, cbar_kws = {'ticks': [-3,0,3]}
    )

    ax.set_title(f'状態 {state_names[i]}')
    if i == 0:
        ax.set_ylabel('共分散行列')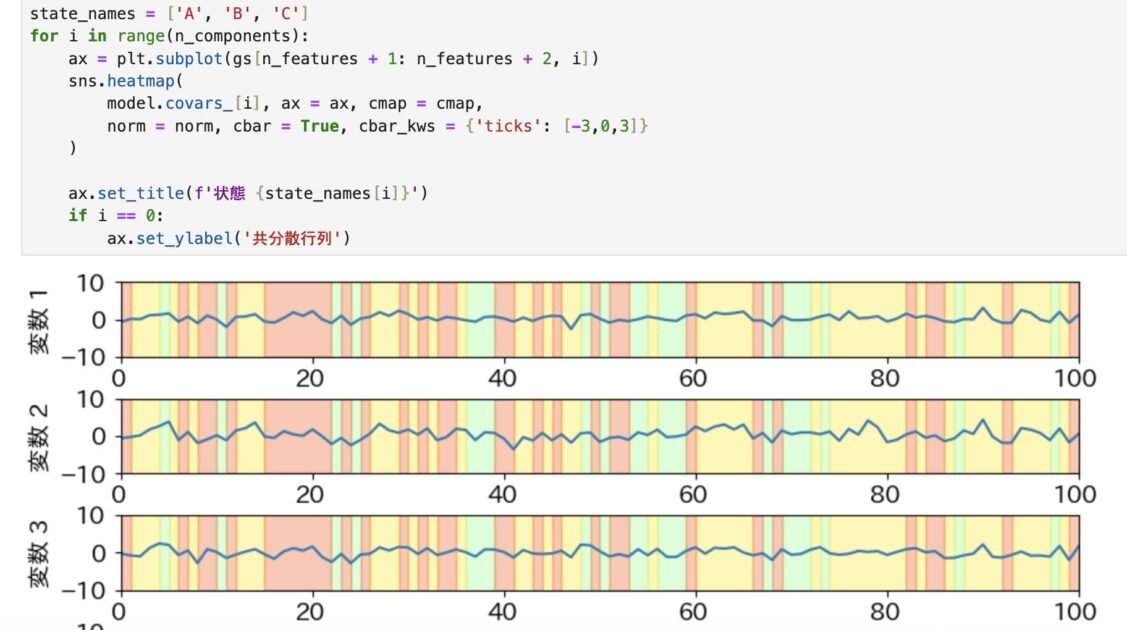
先ほどのエラーはhmmlearnのバージョンの変更による仕様の変更が原因と考えられます。
まとめ
今回の記事では、データ可視化学入門でhmm.GaussianHMMを実行した際に、AttributeErrorが出てしまう場合の対処法について解説しました!
本書はデータ可視化に関する様々なトピック(手法、設計、考え方、見せ方etc..)が網羅的に掲載されており非常に参考になるかつ可視化コードも江崎先生のGithubに公開されているという太っ腹っぷりなので、引き続き本書を読み進めていただければと思います!


コメント